 CARLOS DIEGO C. P.
Technical Post · Amazon Eks
Configuring the Kubernetes Dashboard to Monitor EKS Clusters and Node-Groups
This tutorial walks you through deploying the Kubernetes dashboard https://github.com/kubernetes/dashboard to your Amazon EKS cluster…
Keywords
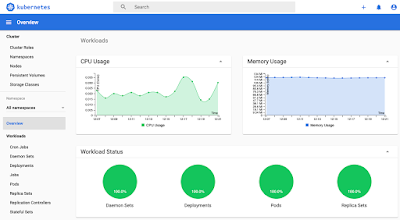
This tutorial walks you through deploying the Kubernetes dashboard https://github.com/kubernetes/dashboard to your Amazon EKS cluster, complete with CPU and memory metrics. It also helps you create an Amazon EKS administrator service account that you can use to securely connect to the dashboard to view and control your cluster.
Prerequisites:
- Create a cluster in EKS (to learn how, check out our series of articles);
- Install a Kubernetes metrics server;
- The security groups for the elastic network interfaces and the Control Plane nodes follow the recommended EKS settings;
- Install kubectl to manage the Amazon EKS cluster.
Steps
- Deploy the Kubernetes dashboard
kubectl apply -f https://raw.githubusercontent.com/kubernetes/dashboard/v2.0.5/aio/deploy/recommended.yamlcurl -o recommended.yaml https://raw.githubusercontent.com/kubernetes/dashboard/v2.0.5/aio/deploy/recommended.yamldocker pull image:<tag>docker tag image:<tag> <aws_account_id>.dkr.ecr.<cn-north-1>.amazonaws.com/image:<tag>docker push image:<tag> <aws_account_id>.dkr.ecr.<cn-north-1>.amazonaws.com/image:<tag>kubectl apply -f recommended.yaml- Create an eks-admin service account
- Create a file named eks-admin-service-account.yaml
apiVersion: v1
kind: ServiceAccount
metadata:
  name: eks-admin
  namespace: kube-system
---
apiVersion: rbac.authorization.k8s.io/v1
kind: ClusterRoleBinding
metadata:
  name: eks-admin
roleRef:
  apiGroup: rbac.authorization.k8s.io
  kind: ClusterRole
  name: cluster-admin
subjects:
- kind: ServiceAccount
  name: eks-admin
namespace: kube-system- Apply the service account and bind it to the cluster role
kubectl apply -f eks-admin-service-account.yamlserviceaccount “eks-admin” createdclusterrolebinding.rbac.authorization.k8s.io “eks-admin” created- Connect to the dashboard
kubectl -n kube-system describe secret $(kubectl -n kube-system get secret | grep eks-admin | awk ‘{print $1}’)kubectl proxy- To access the dashboard endpoint, open the following link in a web browser: http://localhost:8001/api/v1/namespaces/kubernetes-dashboard/services/https:kubernetes-dashboard:/proxy/#!/login.
- Choose Token, paste the <authentication_token> output from the previous command into the Token field, and choose SIGN IN.
See you in the next post! =)
Comments
Every comment is moderated before it appears here. Nothing is published automatically.
Loading…