 CARLOS DIEGO C. P.
Technical Post · Amazon Web Services
Monitoring memory and disk metrics on EC2 instances
In this post, we'll set up collection of Memory and Disk metrics from EC2 instances with the CloudWatch service.
Keywords
In this post, we'll set up collection of Memory and Disk metrics from EC2 instances with the CloudWatch service.

Process steps:
- Provision an EC2 instance
- Create an IAM role
- Configure the EC2 instance
- Monitor the EC2 instance in CloudWatch
Provision an EC2 instance
For teaching purposes, provision an Amazon Linux 2 instance and leave all the default specifications.
Create an IAM role
Using IAM, create a role for EC2 with “CloudWatchFullAccess”. Again for teaching purposes, this is a broader permission than we need, but we'll use it for this tutorial.
Configure the EC2 instance
As a best practice, modify the default security group so that only your IP has inbound access to the instance. Also, make sure the outbound rules allow all traffic to any IP.
Now attach the IAM role you created to the EC2 instance. This allows it to communicate with CloudWatch.
Now, SSH into the instance and run the following commands:
sudo yum install -y perl-Switch perl-DateTime perl-Sys-Syslog perl-LWP-Protocolo-https perl-Digest-SHA.x86_64Download the monitoring scripts:
curl https://aws-cloudwatch.s3.amazonaws.com/downloads/CloudWatchMonitoringScripts-1.2.2.zip -OUnzip, delete, and cd into the monitoring scripts:
unzip CloudWatchMonitoringScripts-1.2.2.zip && \rm CloudWatchMonitoringScripts-1.2.2.zip && \cd aws-scripts-monLog in as root:
sudo suOpen the crontab with export VISUAL=nano; crontab -e and paste the following command. This will send data to CloudWatch every minute:
*/1 * * * * root /home/ec2-user/aws-scripts-mon/mon-put-instance-data.pl — mem-util — mem-used — mem-avail — disk-space-util — disk-space-used — disk-space-avail — disk-path=/This tells the EC2 instance to run a cron job every minute and send memory and disk information to CloudWatch.
Monitor the EC2 instance in CloudWatch
Navigate to CloudWatch in AWS and click “Metrics” on the left.
Next, click “System/Linux ” under Custom namespaces.
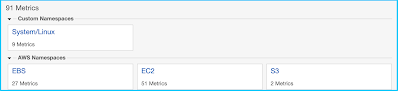
From here, browse “Filesystem, InstanceId, MountPath” and “InstanceId” and check the metrics available in each.

Now, under “Graphed metrics”, you'll see all the metrics you checked.
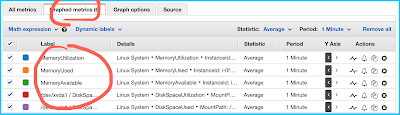
And you can start monitoring the measurements in the graph above. Note that we'll only have a few minutes of data.
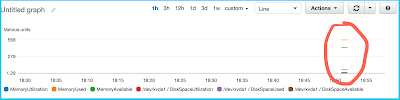
You're now monitoring the memory and hard disk utilization of an EC2 instance.
See you in the next post! =)
Comments
Every comment is moderated before it appears here. Nothing is published automatically.
Loading…