 CARLOS DIEGO C. P.
Technical Post · Cloud Computing
Observability with sidecars in microservices: concepts and hands-on application
In the world of modern microservices-based architectures, observability is a fundamental component. Making sure you have…
Keywords
In the world of modern microservices-based architectures, observability is a fundamental component. Making sure you have full visibility into the behavior and state of your applications is essential for spotting problems and ensuring your services are running correctly.
A common approach to adding observability to microservices is a design pattern called the “sidecar.” This post explores the concept of an observability sidecar, followed by a hands-on example of how to implement one with a simple To-do List application on AWS, using Python for the application logic and Terraform to provision the infrastructure.

What is an observability sidecar?
The term “sidecar” refers to the idea of adding extra functionality to a main application container without directly modifying its code. Just as a motorcycle sidecar rides alongside the motorcycle, a sidecar in an application runs in parallel with the microservice it is observing. The sidecar can be responsible for a number of functions, such as:
- Logs: Capturing structured logs and shipping them to centralized observability tools.
- Metrics: Collecting performance metrics and exposing them to monitoring services.
- Tracing: Adding distributed tracing capabilities to make it easier to pinpoint problems in the application.
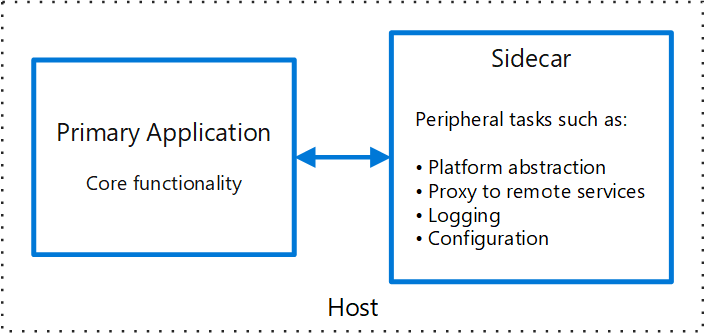
The sidecar is usually implemented as a separate container that is deployed alongside the main (application) container and operates as an observability layer.
Hands-on: a “to-do list” with an observability sidecar
In this example, we will build a simple To-do List application in Python and set up an observability sidecar that monitors metrics for the HTTP requests made to the microservice. We will use AWS as the cloud provider, deploying the infrastructure with Terraform and using Prometheus for metrics.
Solution structure
- Main application: A Python Flask application that exposes a RESTful API for managing To-dos.
- Sidecar: A parallel service for collecting metrics, which will be exposed to Prometheus.
- AWS infrastructure: Services such as ECS (Elastic Container Service) for container orchestration, CloudWatch for logs, and an Application Load Balancer (ALB) to route requests.
Step by step
1. Building the to-do list application
The application will be a simple Flask API:
# todo_app.py
from flask import Flask, request, jsonify

app = Flask(__name__)
todos = []
@app.route('/todos', methods=['GET'])
def get_todos():
    return jsonify(todos), 200
@app.route('/todos', methods=['POST'])
def create_todo():
    data = request.json
    todos.append(data)
    return jsonify(data), 201
@app.route('/todos/<int:todo_id>', methods=['DELETE'])
def delete_todo(todo_id):
    if 0 <= todo_id < len(todos):
        todos.pop(todo_id)
        return '', 204
    return 'Not found', 404
if __name__ == '__main__':
    app.run(host='0.0.0.0', port=5000)
This code implements a basic API with three endpoints:
GET /todosto list To-dos.POST /todosto add a new To-do.DELETE /todos/<id>to remove a To-do by ID.
2. Building the observability sidecar
We will use a separate container to capture metrics from the HTTP requests, which will be exposed for Prometheus to scrape.
# sidecar.py
from flask import Flask, request
from prometheus_client import Counter, generate_latest

app = Flask(__name__)

# Definindo métricas de requisições
REQUEST_COUNT = Counter('request_count', 'Total number of requests', ['method', 'endpoint'])

@app.before_request
def before_request():
    REQUEST_COUNT.labels(method=request.method, endpoint=request.path).inc()

@app.route('/metrics')
def metrics():
    return generate_latest(), 200

if __name__ == '__main__':
    app.run(host='0.0.0.0', port=9000)
In this sidecar, we add a counter (Counter) for every request received by the main microservice, exposing the metrics on the /metrics endpoint.
3. Provisioning the infrastructure with Terraform
We will set up the infrastructure on AWS using Terraform to create an ECS Cluster, define the tasks for the containers, and provision the required resources such as the VPC, subnets, ALB, and so on.
# main.tf
provider "aws" {
  region = "us-west-2"
}

resource "aws_vpc" "main" {
  cidr_block = "10.0.0.0/16"
  tags = {
    Name = "observability-vpc"
  }
}

resource "aws_subnet" "main" {
  vpc_id     = aws_vpc.main.id
  cidr_block = "10.0.1.0/24"
  availability_zone = "us-west-2a"
}

resource "aws_ecs_cluster" "main" {
  name = "observability-ecs"
}

resource "aws_ecs_task_definition" "todo" {
  family = "todo-sidecar"
  network_mode = "awsvpc"

  container_definitions = jsonencode([
    {
      name      = "todo-app"
      image     = "python:3.9-slim" # substitua pela sua imagem Docker da aplicação
      cpu       = 256
      memory    = 512
      essential = true
      portMappings = [
        {
          containerPort = 5000
        }
      ]
    },
    {
      name      = "sidecar"
      image     = "python:3.9-slim" # substitua pela sua imagem Docker do sidecar
      cpu       = 128
      memory    = 256
      essential = true
      portMappings = [
        {
          containerPort = 9000
        }
      ]
    }
  ])

  requires_compatibilities = ["FARGATE"]
  memory = "1GB"
  cpu    = "512"
}

resource "aws_ecs_service" "todo" {
  name            = "todo-service"
  cluster         = aws_ecs_cluster.main.id
  task_definition = aws_ecs_task_definition.todo.arn
  desired_count   = 1
  launch_type     = "FARGATE"

  network_configuration {
    subnets         = [aws_subnet.main.id]
    assign_public_ip = true
  }
}
This basic Terraform example creates a VPC, subnets, an ECS Cluster, and a task definition for the application and the sidecar, and configures the service with one task running on Fargate.
4. Connecting the application to the sidecar
In this example, the sidecar is implemented as a separate container that will be deployed alongside the To-do List microservice on ECS. Prometheus can then be configured to scrape the metrics from the /metrics endpoint exposed by the sidecar.
Final thoughts
Implementing sidecars in a microservices architecture makes it easy to add observability without modifying the main application's code. The proposed solution provides visibility into HTTP metrics and can be extended to include logs and tracing. The combination of Python for the microservice logic, Prometheus for metrics collection, and Terraform for provisioning the AWS infrastructure makes this solution easy to automate and scale.
See you in the next post! =)
Comments
Every comment is moderated before it appears here. Nothing is published automatically.
Loading…