 CARLOS DIEGO C. P.
Technical Post · Amazon Eks
Control Plane Metrics with Prometheus for EKS
Prometheus is an open-source systems monitoring and alerting toolkit originally built at SoundCloud. Since its…
Keywords

Prometheus is an open-source systems monitoring and alerting toolkit originally built at SoundCloud. Since its inception in 2012, many companies and organizations have adopted Prometheus, and the project has a very active developer and user community. It is now a standalone open-source project, maintained independently of any company. To emphasize this, and to clarify the project’s governance structure, Prometheus joined the Cloud Native Computing Foundation in 2016 as the second hosted project, after Kubernetes.
When it comes to monitoring containerized Kubernetes environments, the Kubernetes API server exposes a number of metrics that are useful for monitoring and analysis. These metrics are exposed internally through a metrics endpoint that refers to the /metrics HTTP API. Like other endpoints, this endpoint is exposed on the Amazon EKS control plane. In this post, we will discuss how to implement EKS control plane metrics with Prometheus.
Viewing metrics
To view the metrics output, use kubectl with — raw. This command lets you pass any HTTP path and returns the response.
kubectl get — raw /metricsThis raw output returns verbatim what the API server exposes. These metrics are represented in a Prometheus format. This format allows the API server to expose different metrics broken down by line. Each line includes a metric name, tags and a value.
<metric_name>{“<tag>”=”<value>”[<,…>]} <value>Deploying Prometheus
Here we will see how to deploy Prometheus into the cluster with Helm V3. If you already have Helm installed, you can check its version with the helm version command. Helm is a package manager for Kubernetes clusters. For more information about Helm and how to install it, see Using Helm with Amazon EKS.
Deploy Prometheus using Helm
Create a Prometheus namespace
kubectl create namespace prometheusAdd the prometheus-community chart repository
helm repo add prometheus-community https://prometheus-community.github.io/helm-chartsDeploy Prometheus
helm upgrade -i prometheus prometheus-community/prometheus \
 — namespace prometheus \
— set alertmanager.persistentVolume.storageClass=”gp2",server.persistentVolume.storageClass=”gp2"Verify that all of the pods in the prometheus namespace are in the READY state
kubectl get pods -n prometheusUse kubectl to port forward the Prometheus console to your local machine
kubectl — namespace=prometheus port-forward deploy/prometheus-server 9090Point a web browser to localhost:9090 to view the Prometheus console
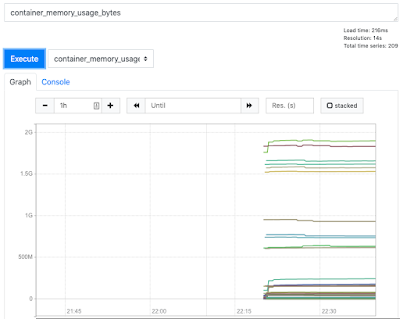
Choose a metric from the — insert metric at cursor menu, then choose “Execute”. Choose the Graph tab to show the metric over time. The following image shows container_memory_usage_bytes over time.
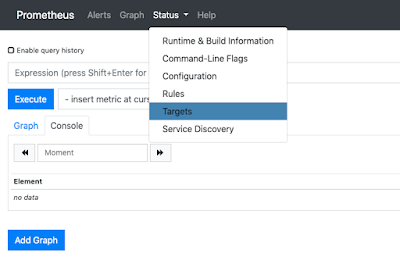
All of the Kubernetes endpoints that are connected to Prometheus using service discovery are displayed.
Comments
Every comment is moderated before it appears here. Nothing is published automatically.
Loading…